In the following you can find a comprehensive visualization of all
the possible templates that you can access using
pie_bake(),
pie_bake_pro(),
bubble_blow() and an example of the usage
of pie_addimages().
Please note that the quality of the images is deliberately reduced
compared to the classic quality of the function outputs for issues
related to the size of the files.
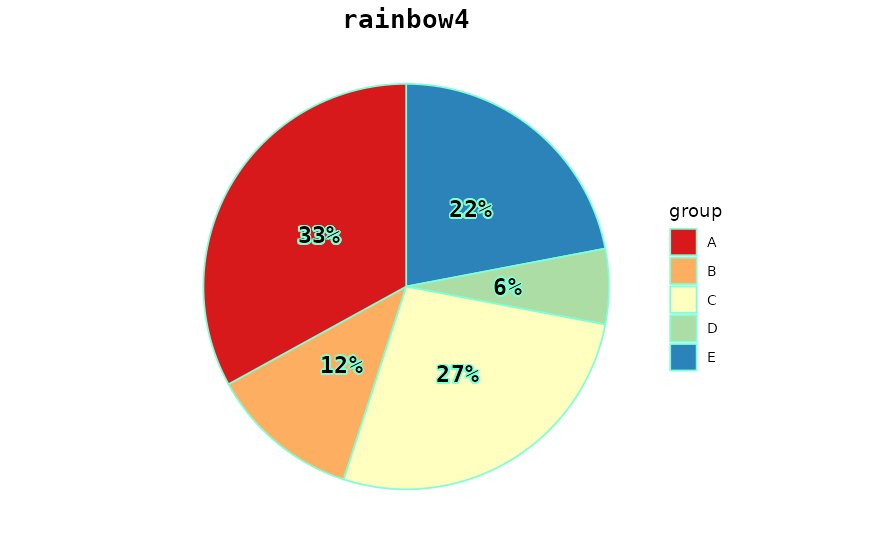
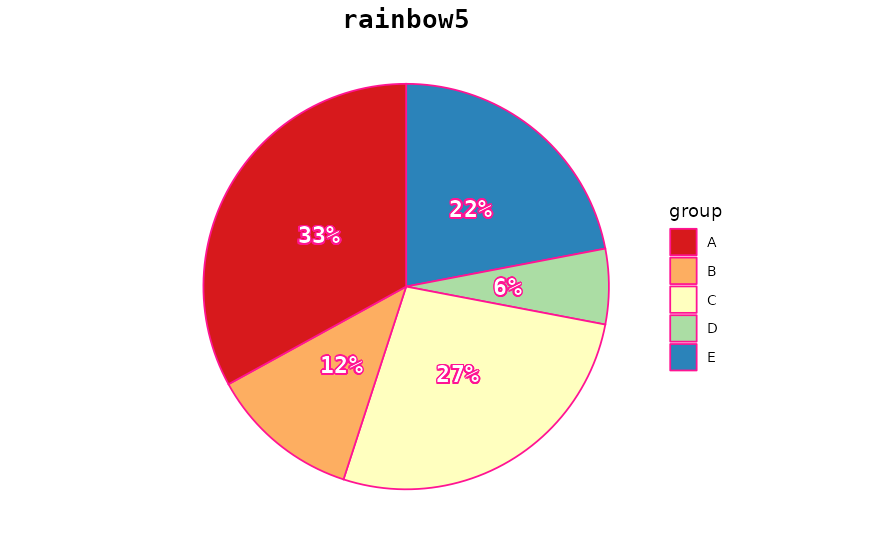
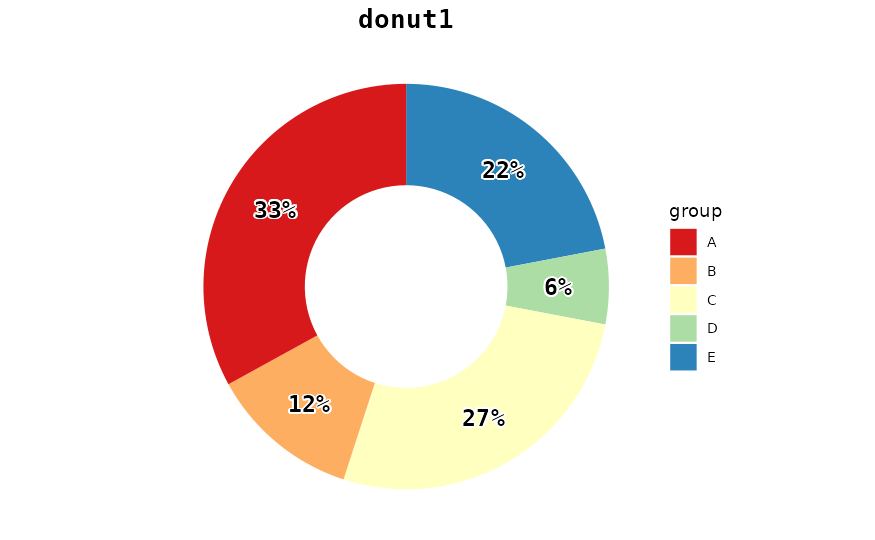
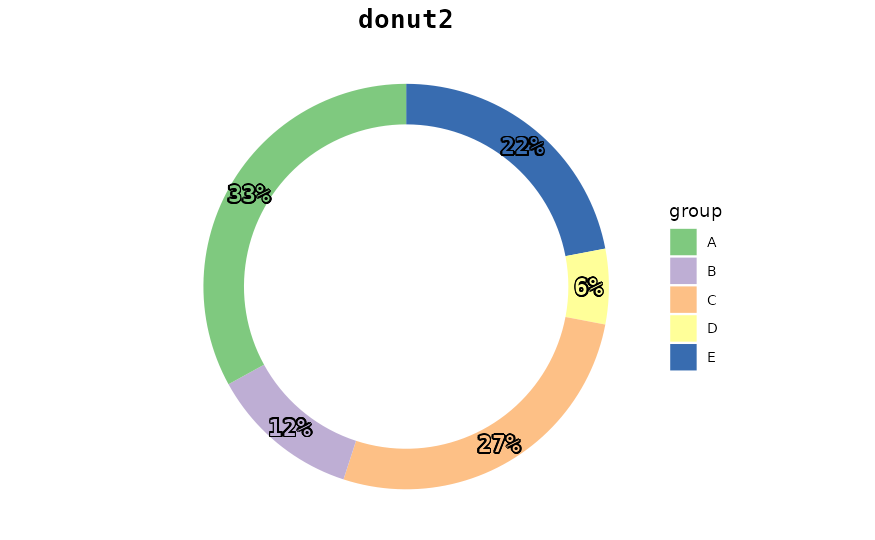
Available templates for
pie_bake()
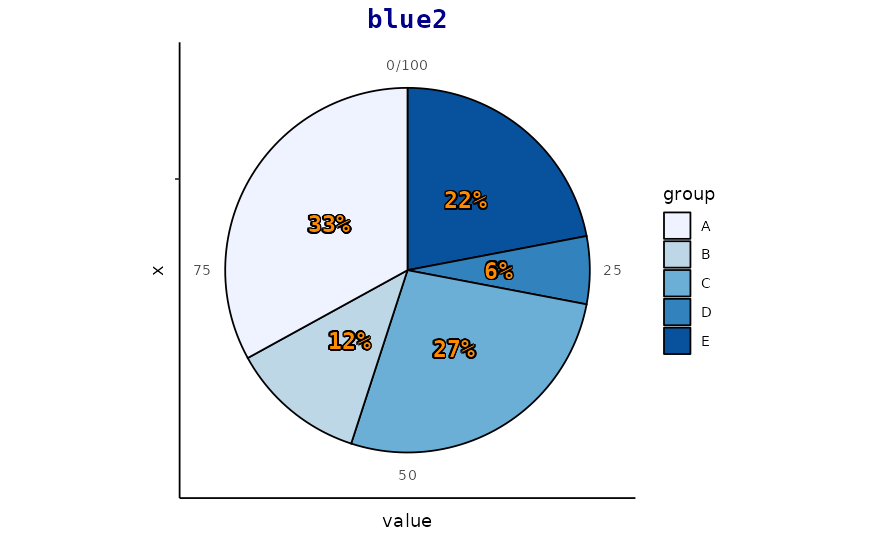
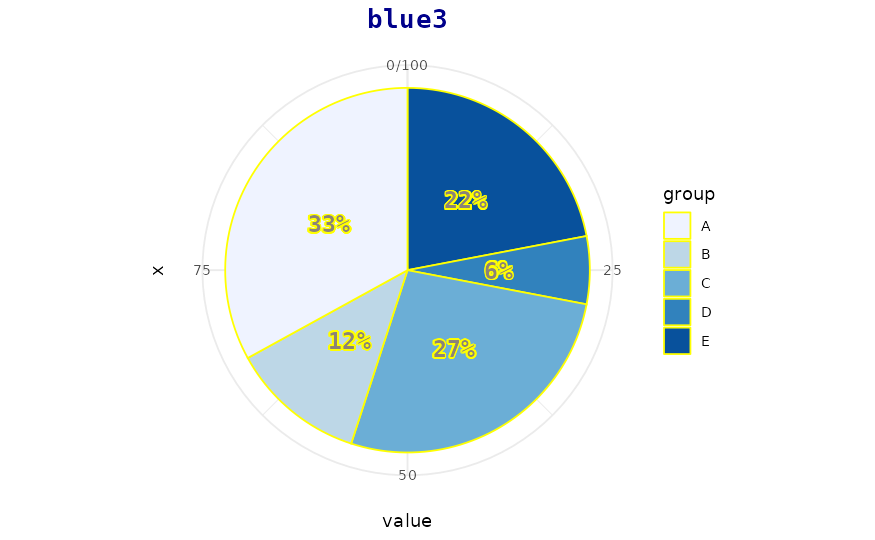
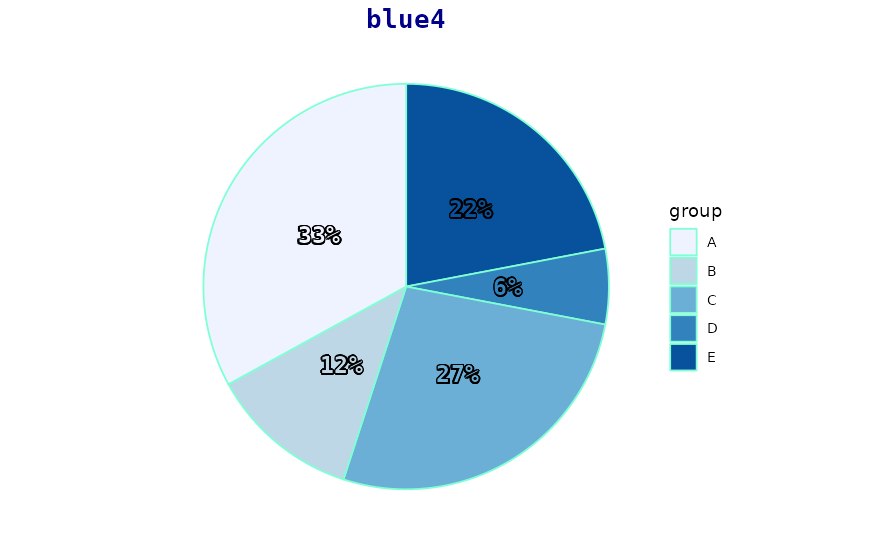
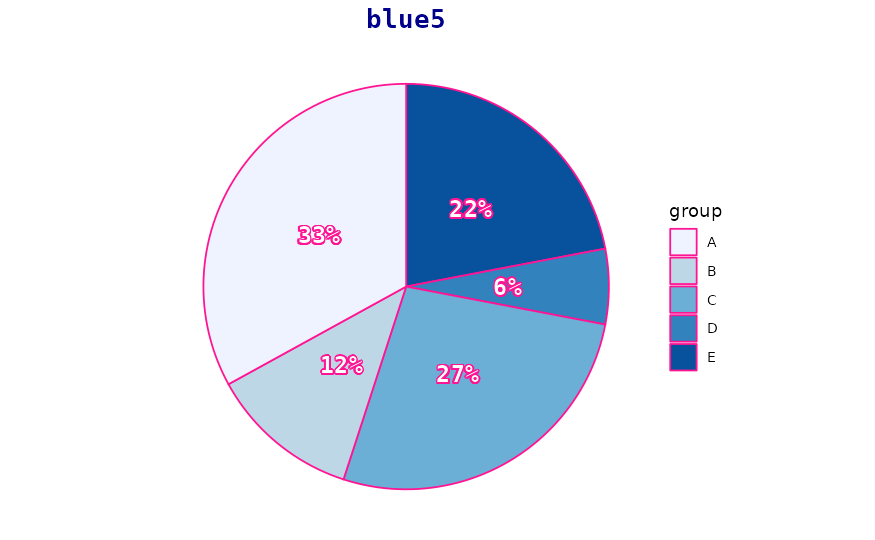
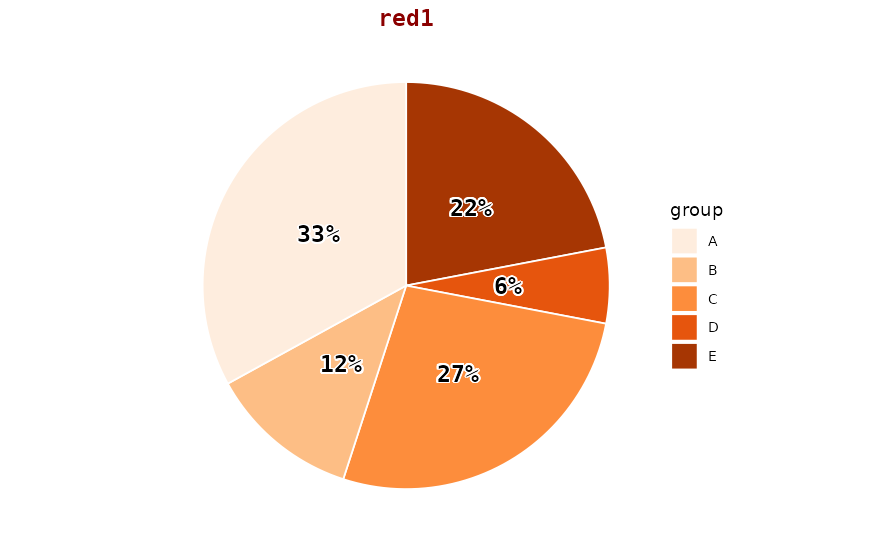
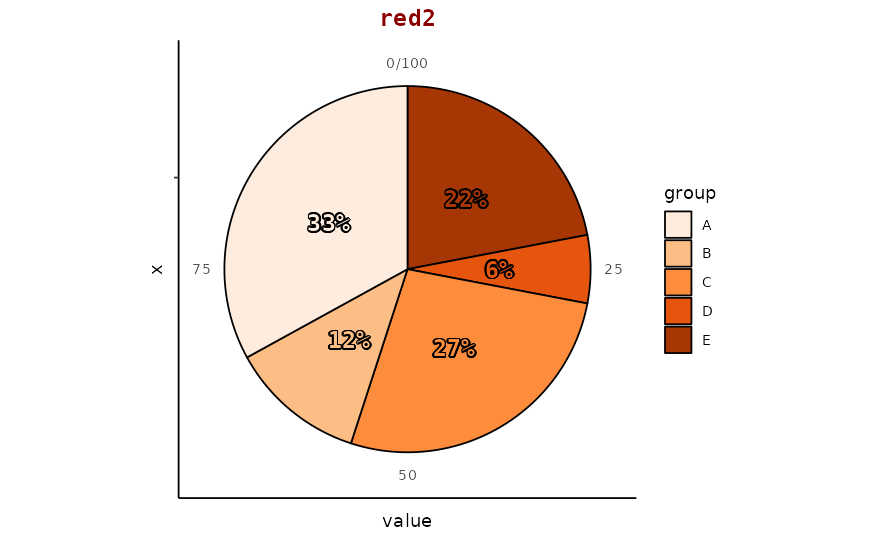
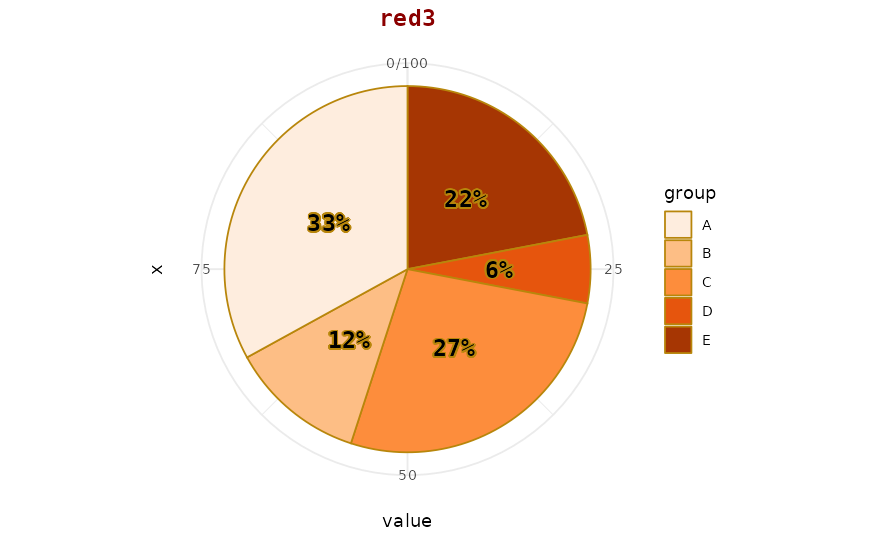
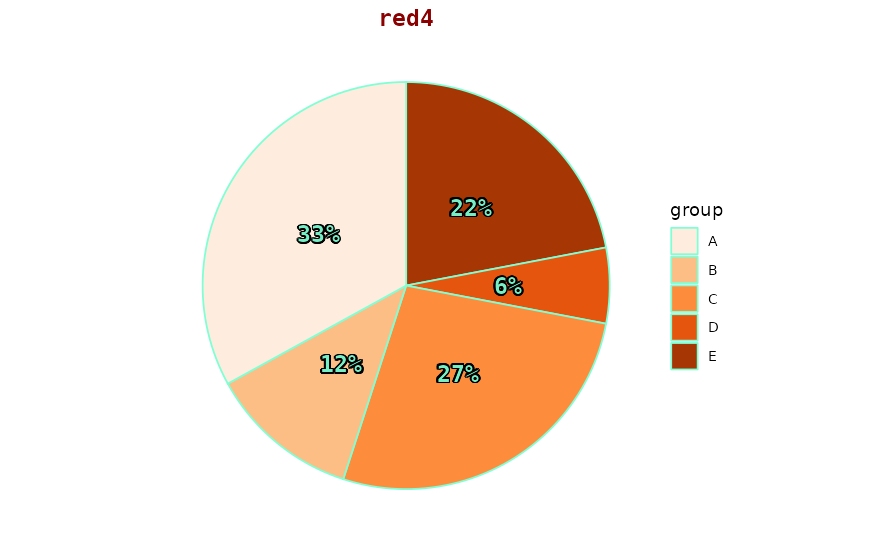
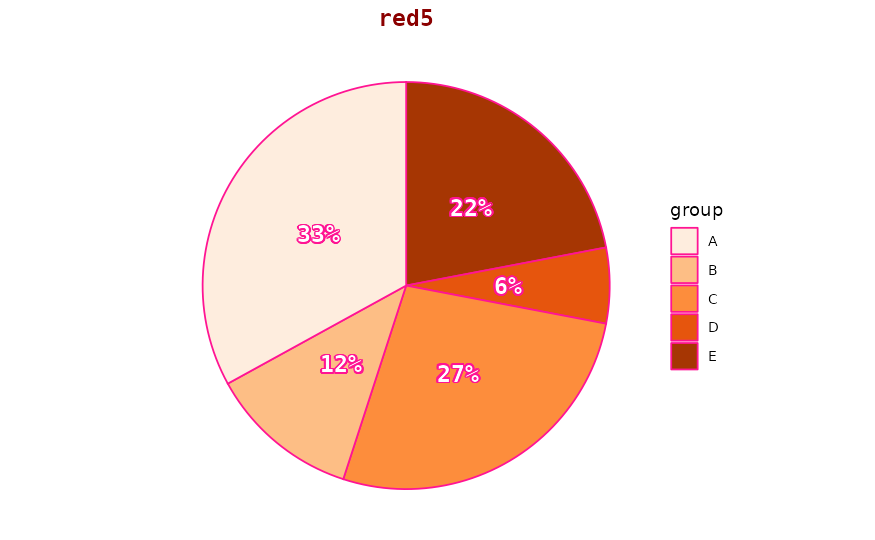
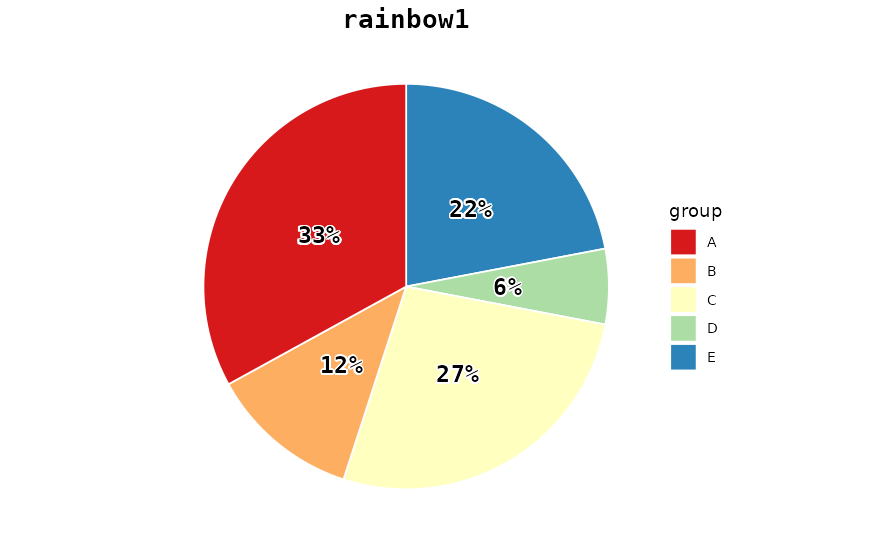
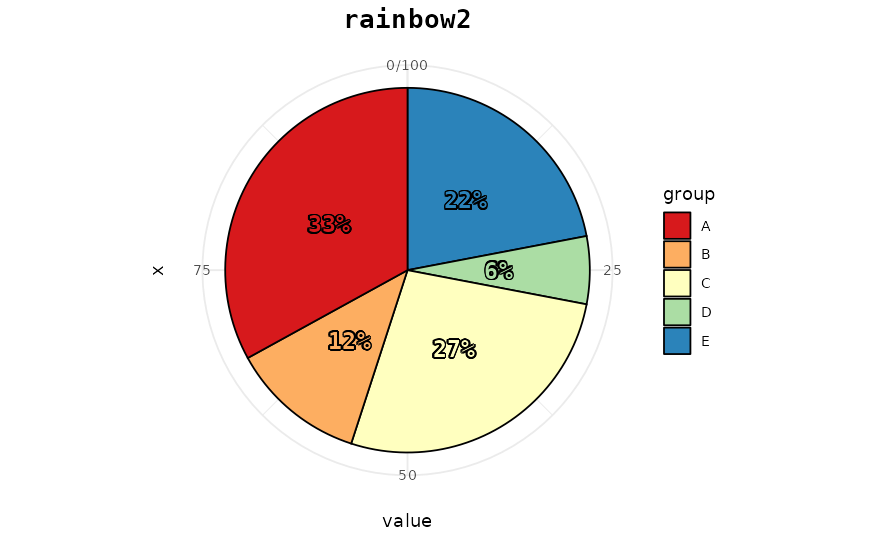
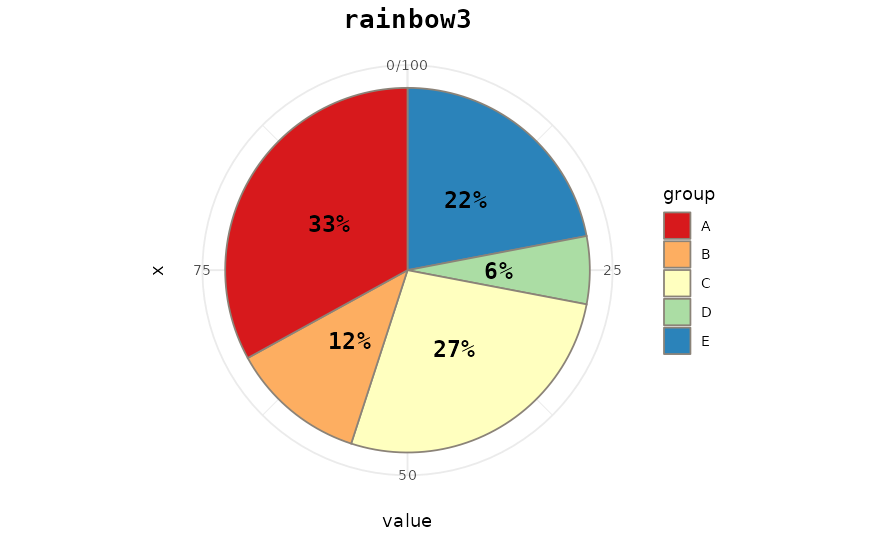
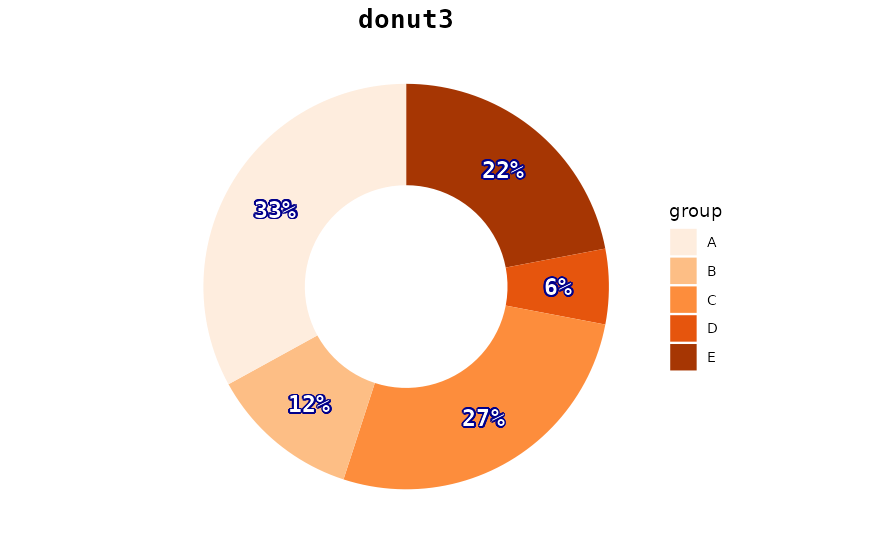
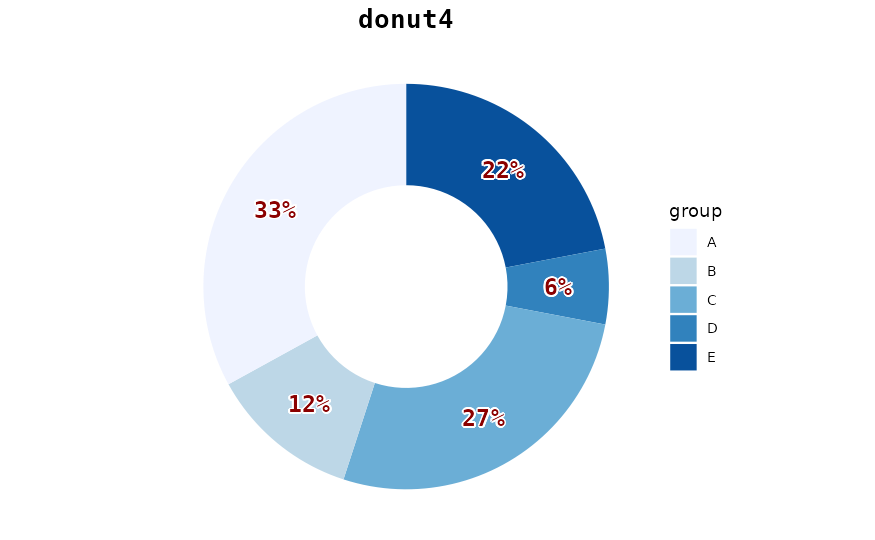
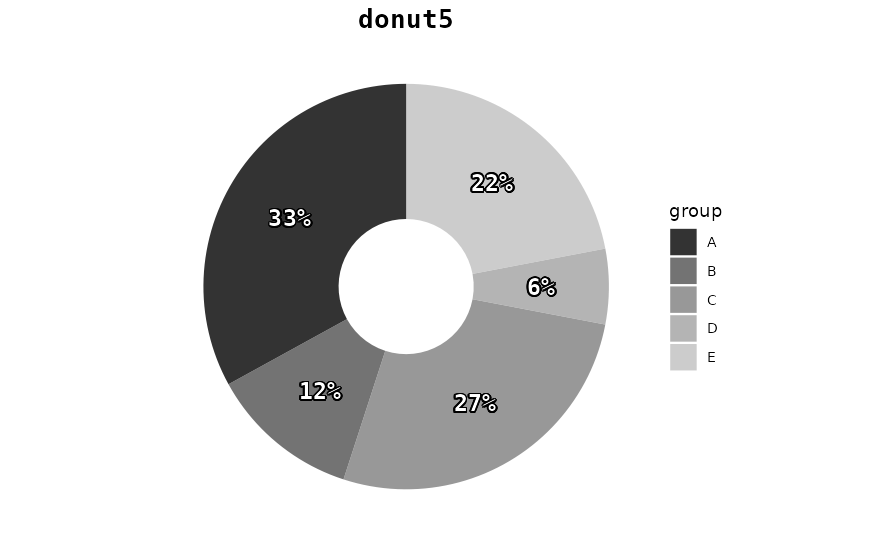
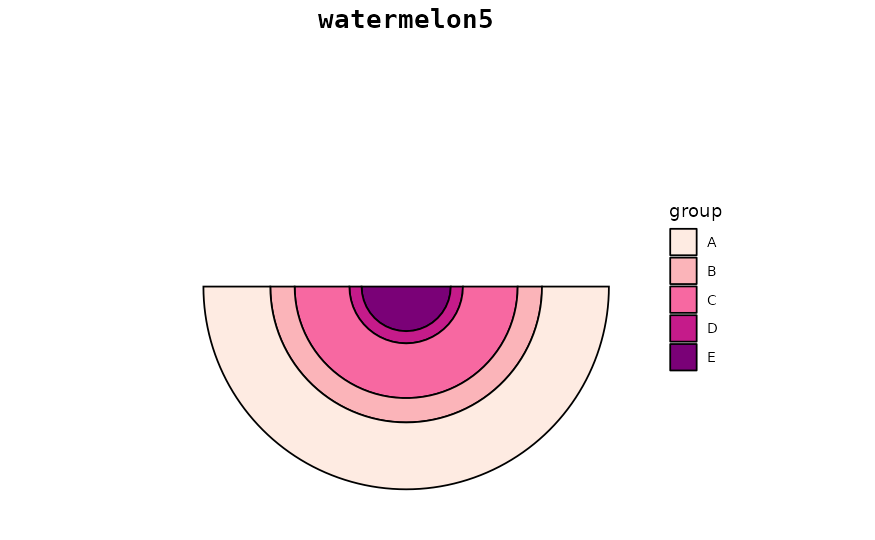
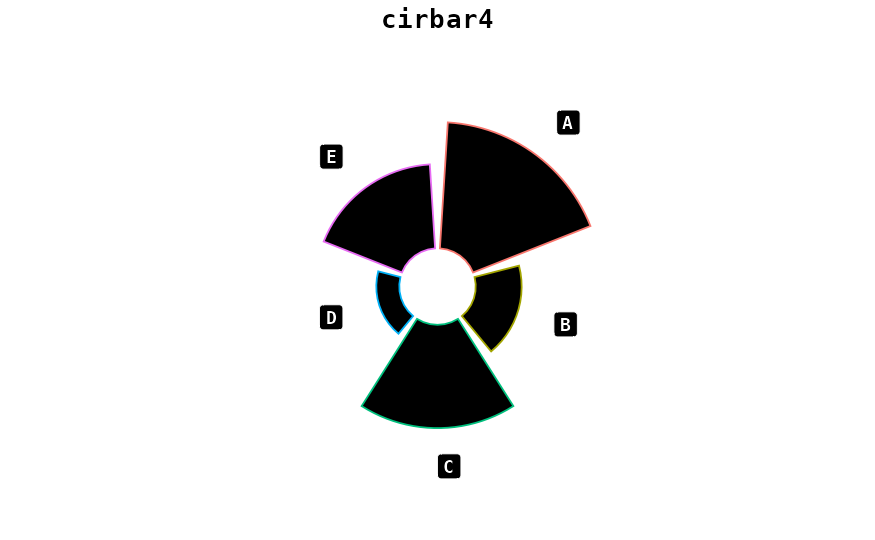
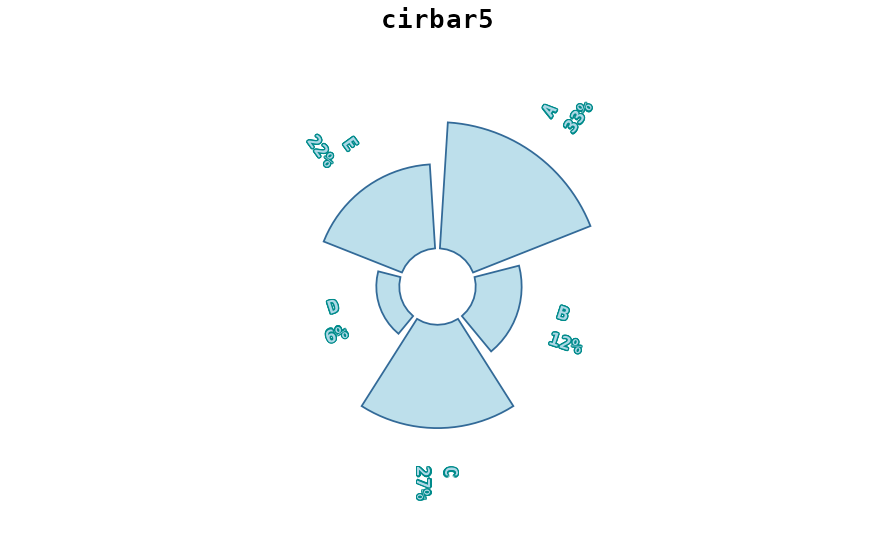
A fairly simple data frame with 5 groups will be considered.
Percentages will be displayed (i.e. the argument perc will
be fixed to TRUE), with the title corresponding to the
template name and a generic group name (i.e. “groups”).
The same for the
pie_bake_pro() function can be found
by scrolling down.
library(tastypie)
#>             $$  $$  $$
#>           __||__||__||__
#>          | * * * * * * *|
#>          |* * * * * * * |
#>          | * * * * * * *|
#>          |______________|
#>  _              _              _
#> | |_  ___  ___ | |_  _ _  ___ |_| ___
#> |  _|| .'||_ -||  _|| | || . || || -_|
#> |_|  |__,||___||_|  |_  ||  _||_||___|
#>                     |___||_|
ex <- data.frame(
  LETTERS[1:5],
  c(65, 24, 54, 12, 43)
)

for(i in pie_template_list){
  print(pie_bake(ex, template = i, perc = TRUE, title = i))
}


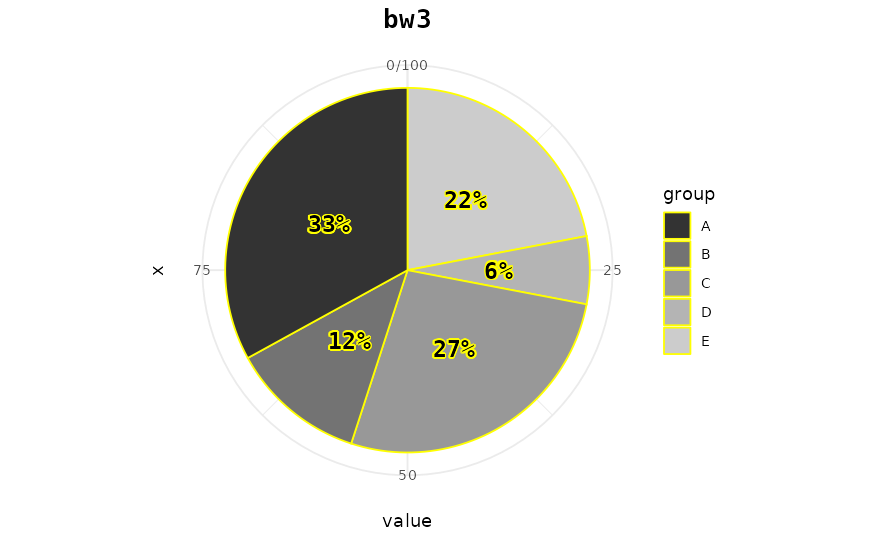
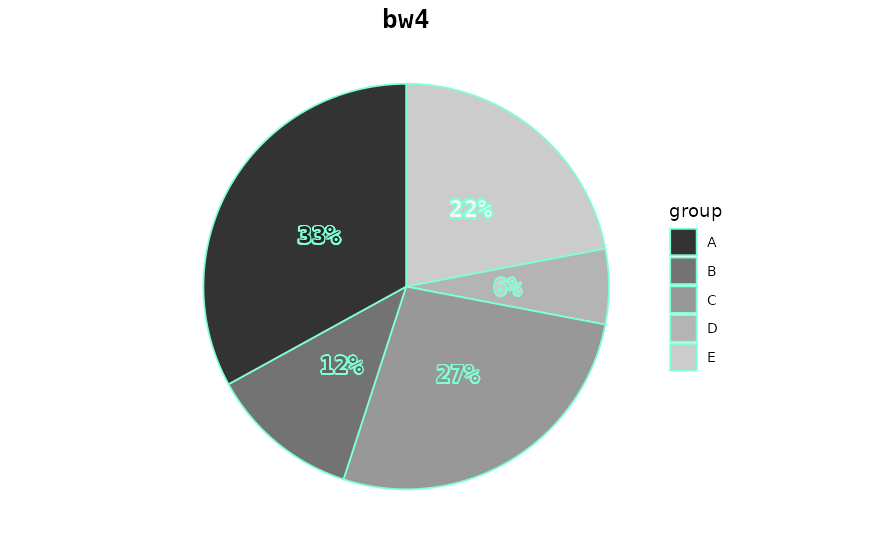
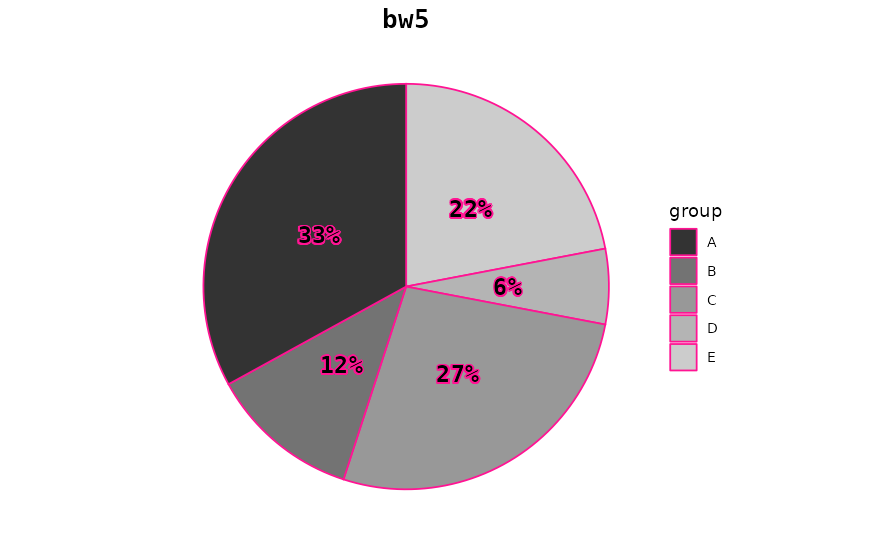
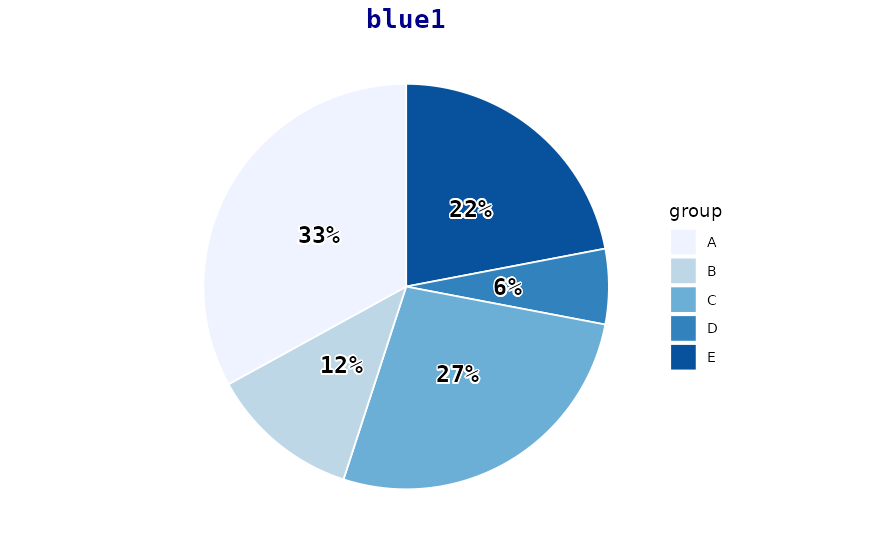
Available templates for
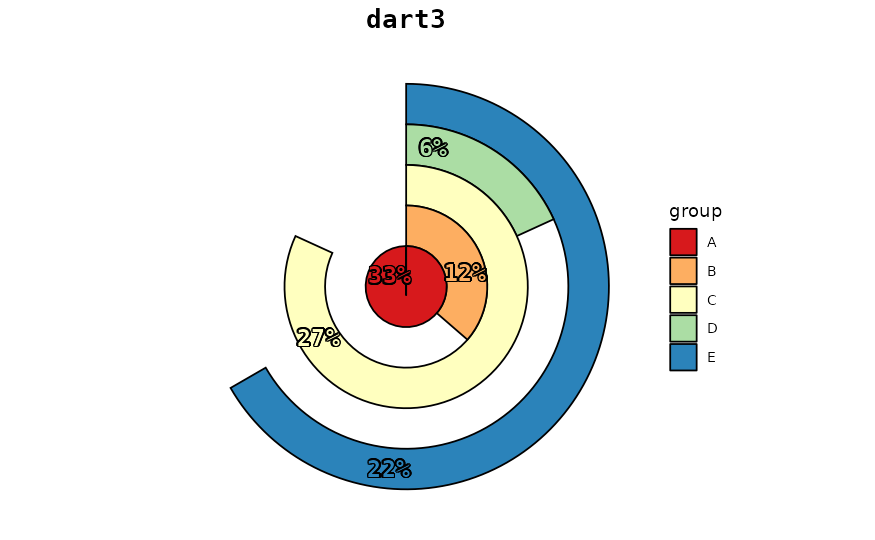
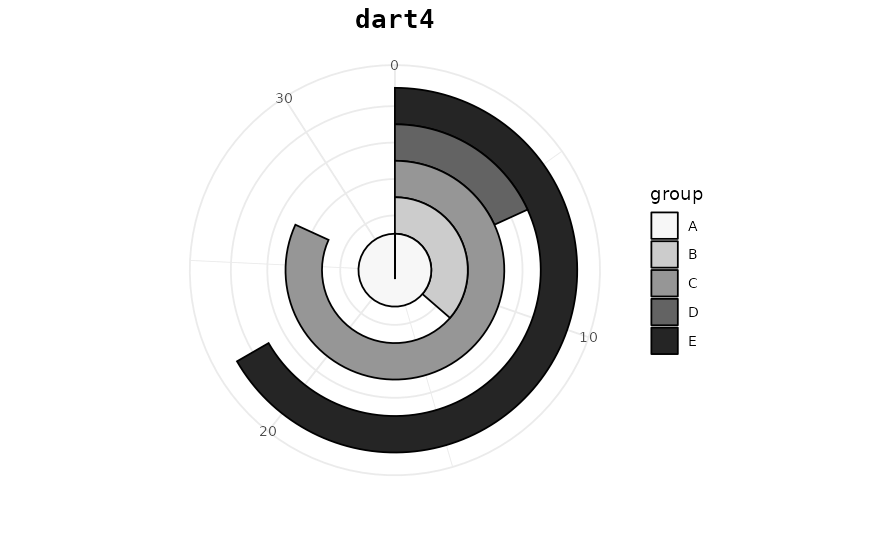
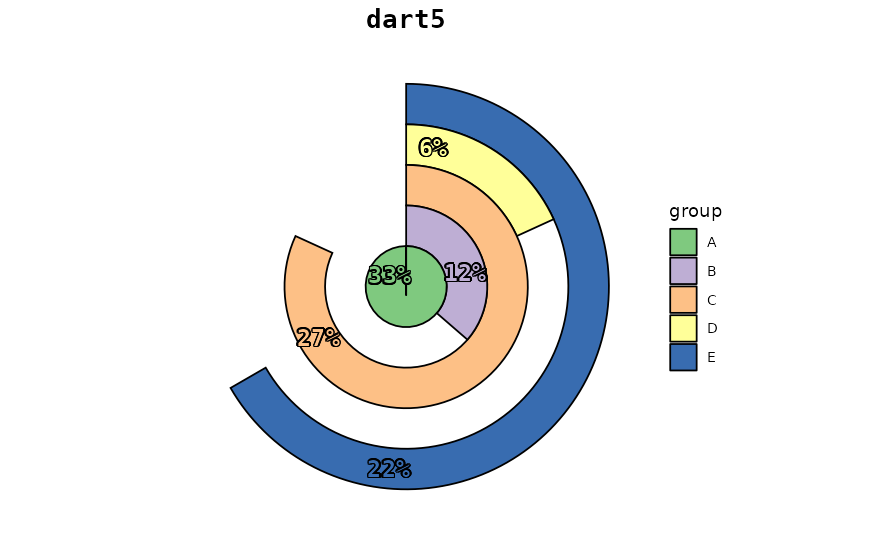
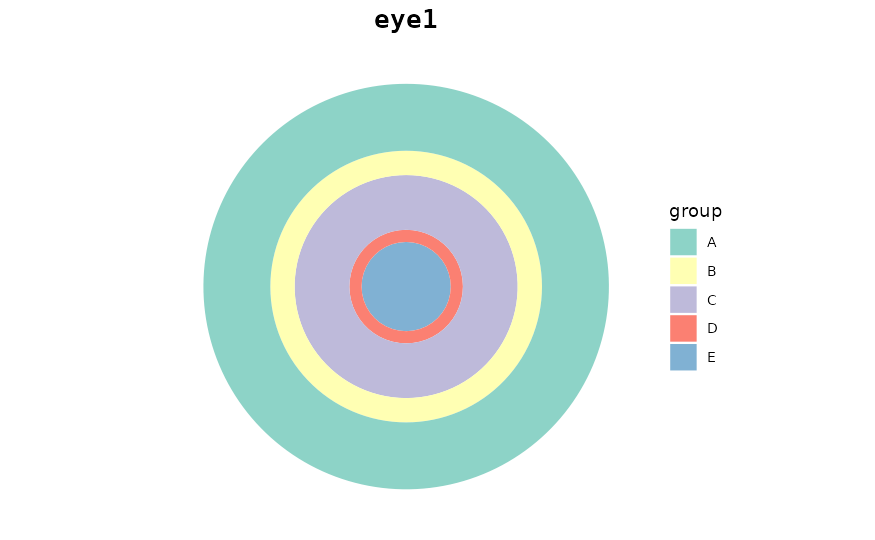
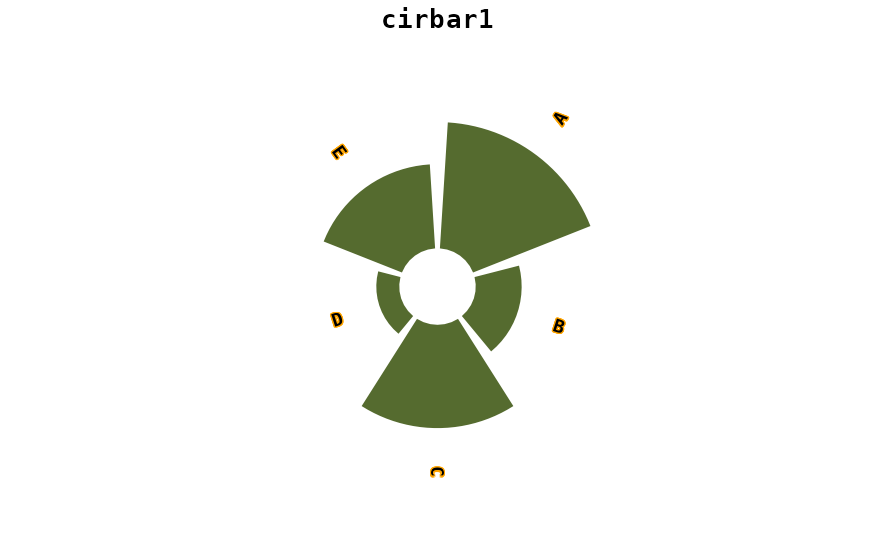
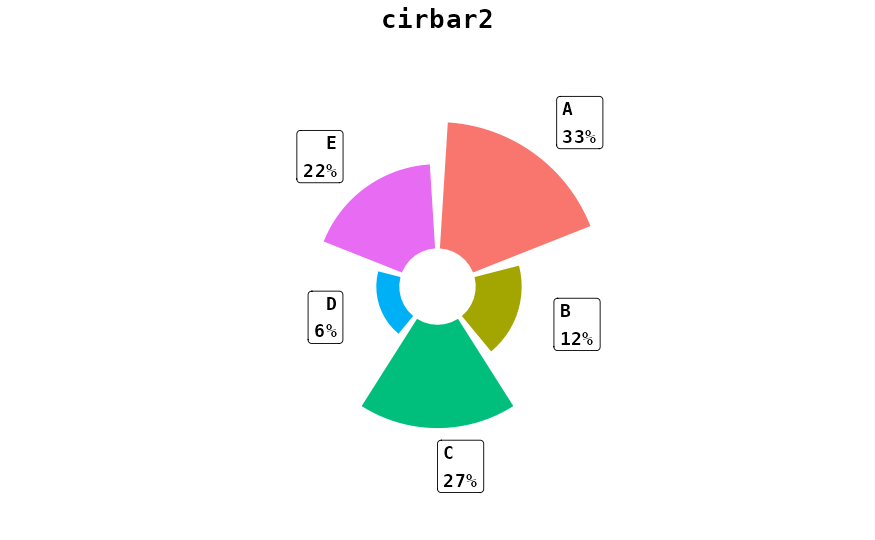
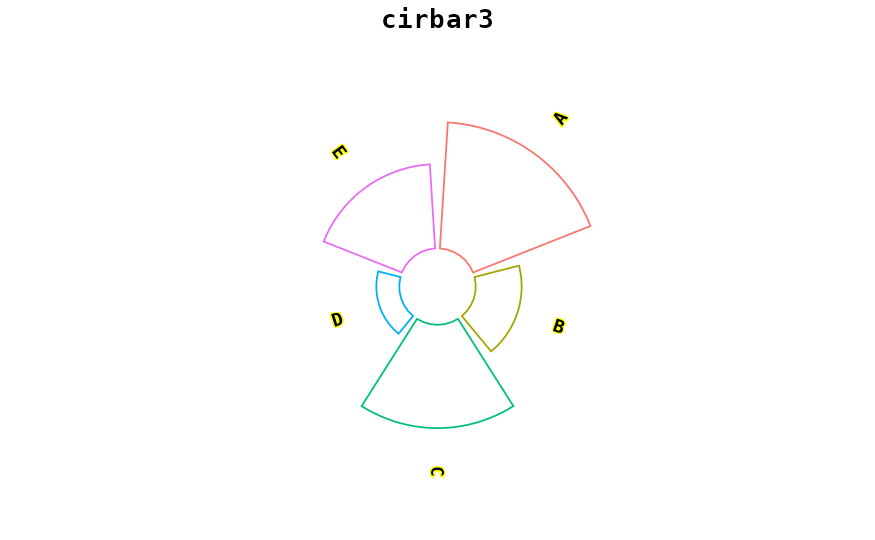
pie_bake_pro()
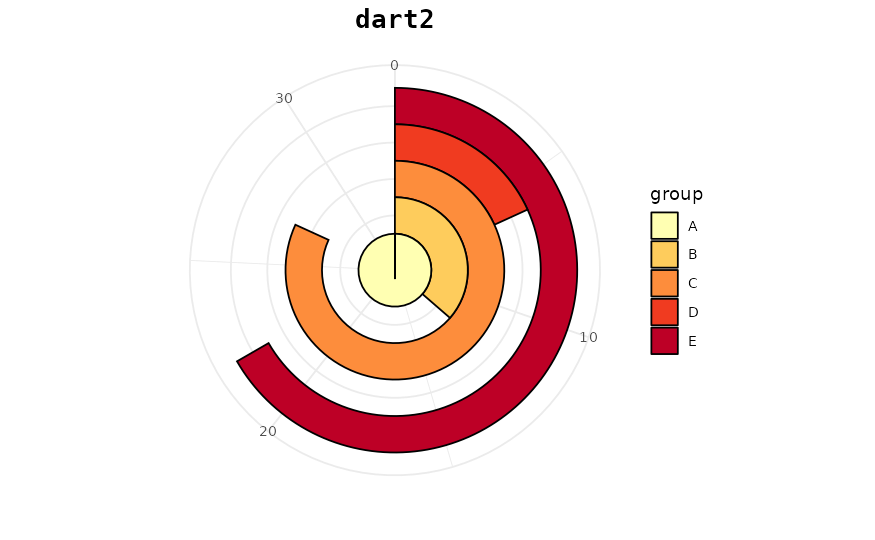
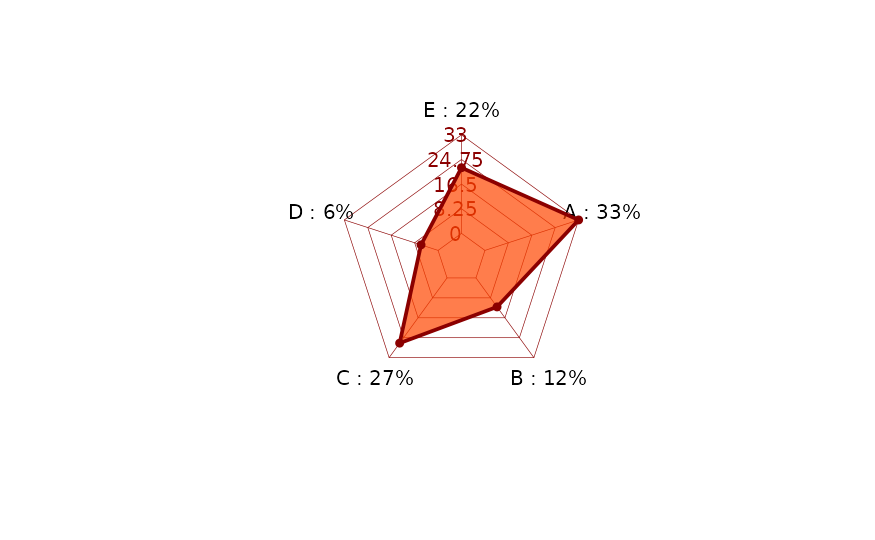
Here we don’t have to set the argument perc (there are
some templates that display percentages anyways).
ex <- data.frame(
  LETTERS[1:5],
  c(65, 24, 54, 12, 43)
)

for(i in pie_template_list_pro){
  print(pie_bake_pro(ex, template = i, title = i))
}


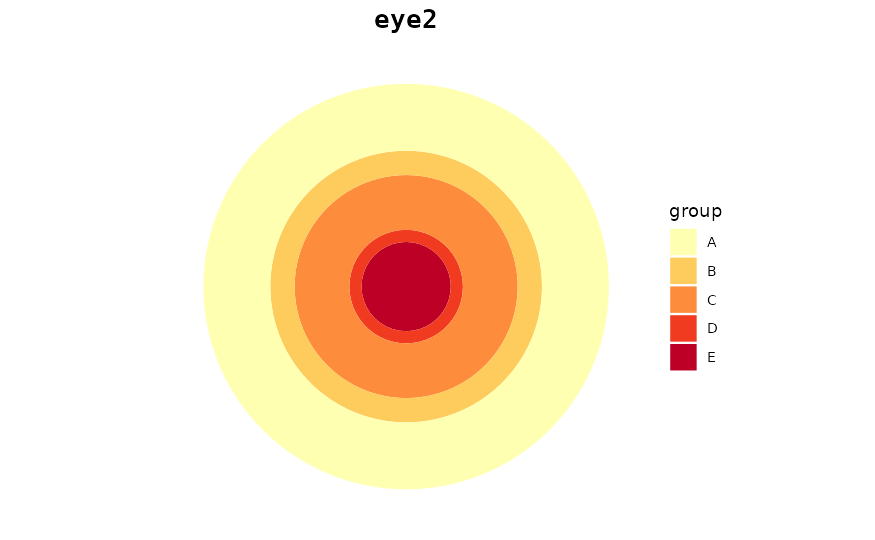
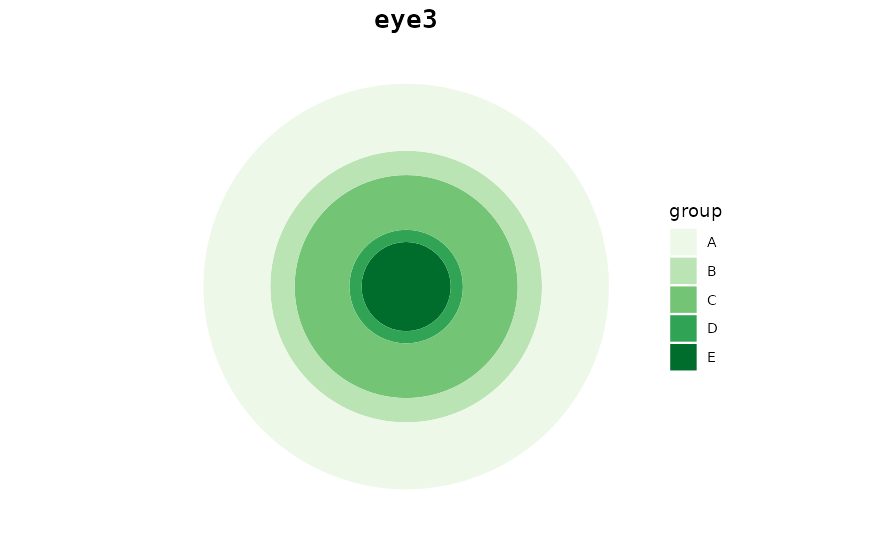
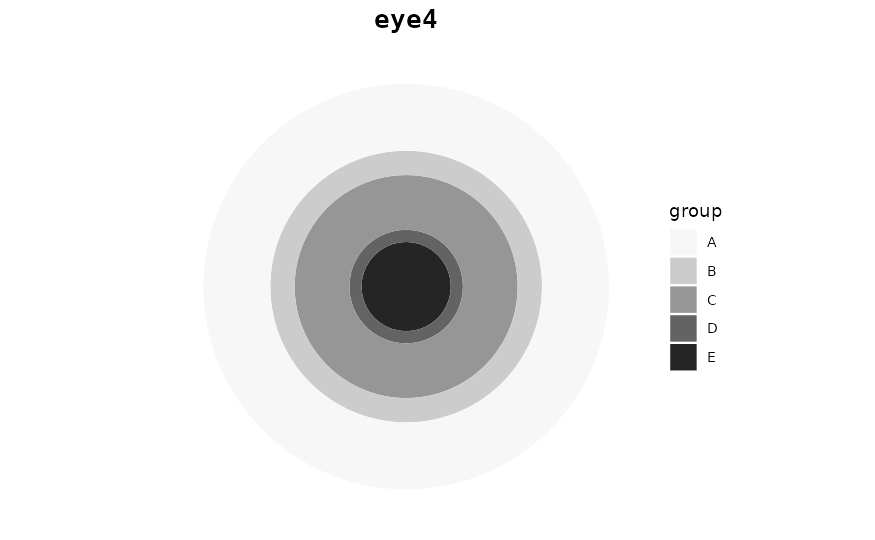
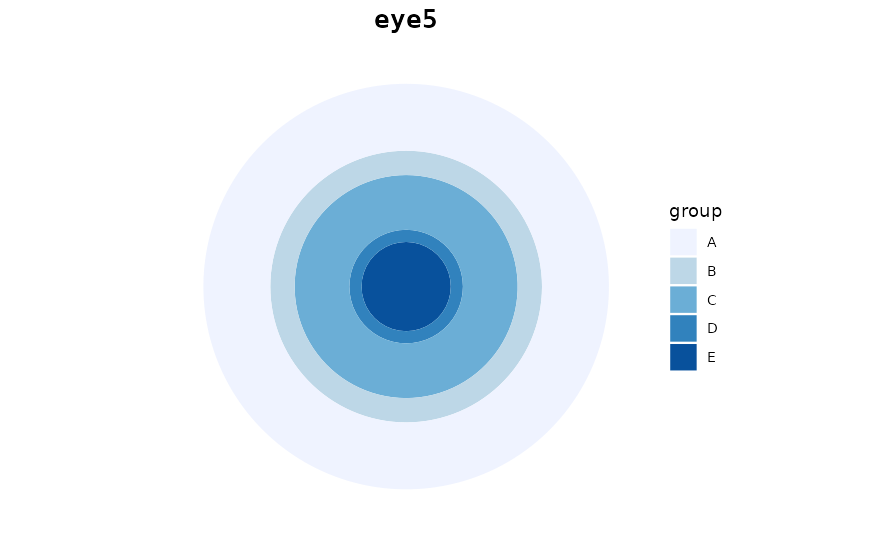
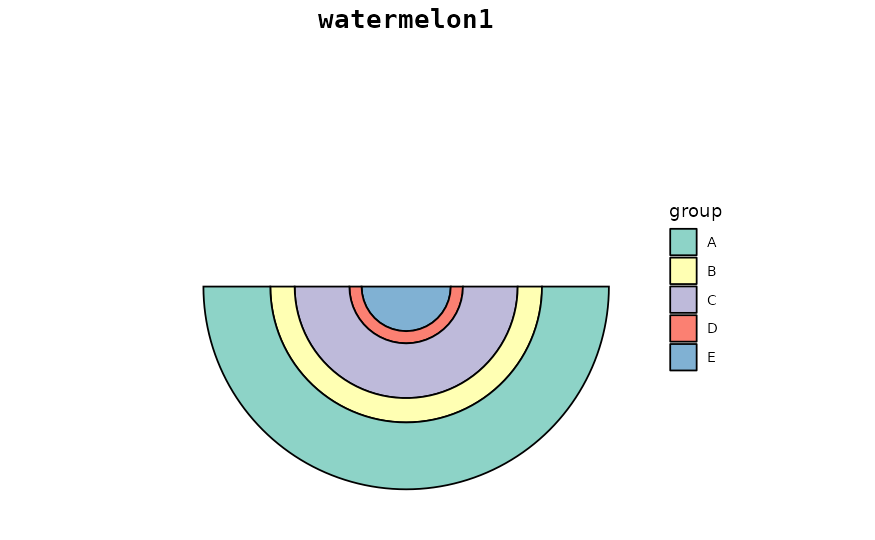
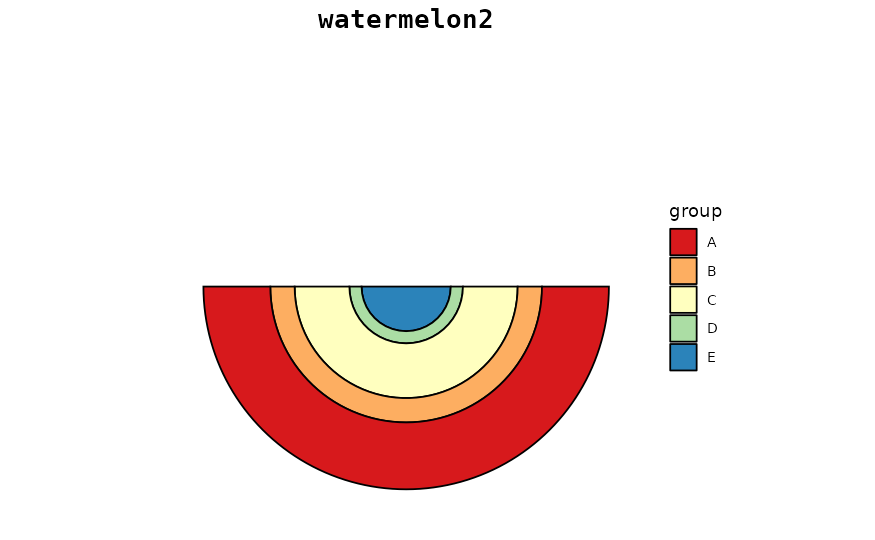
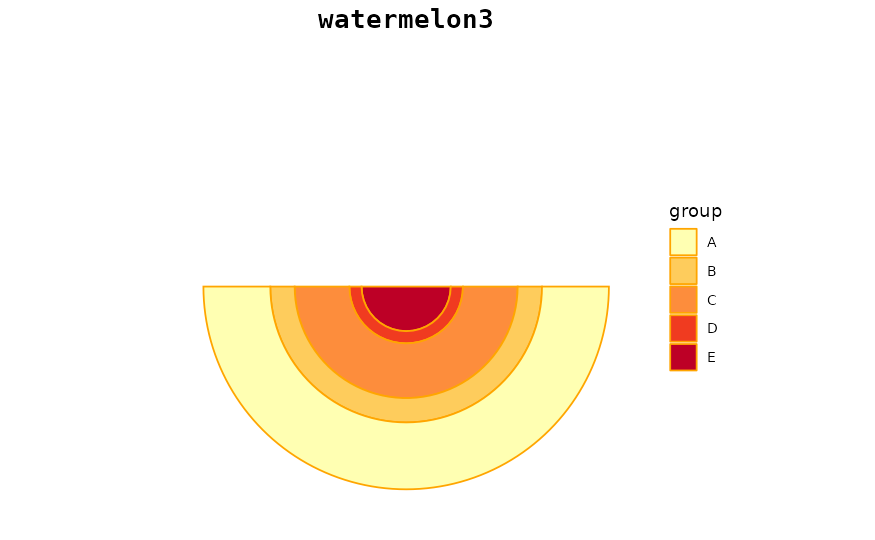
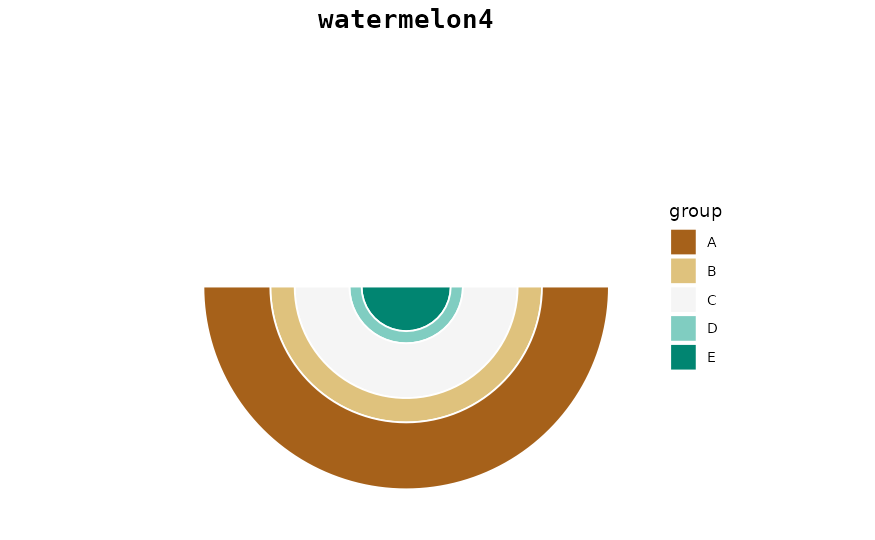
#> NULL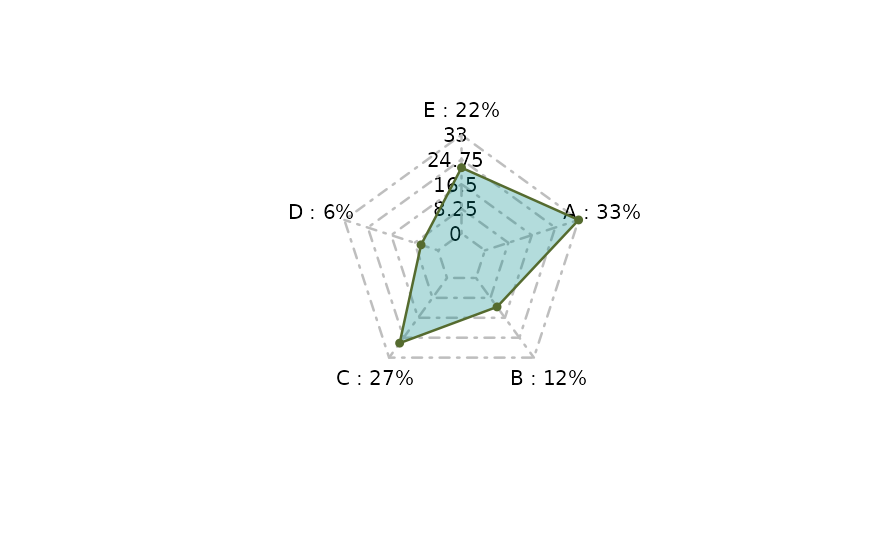
#> NULL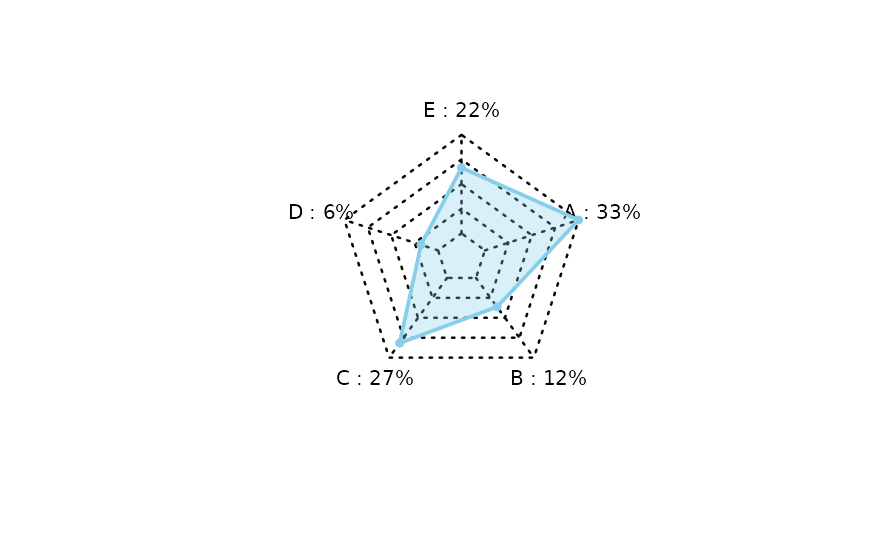
#> NULL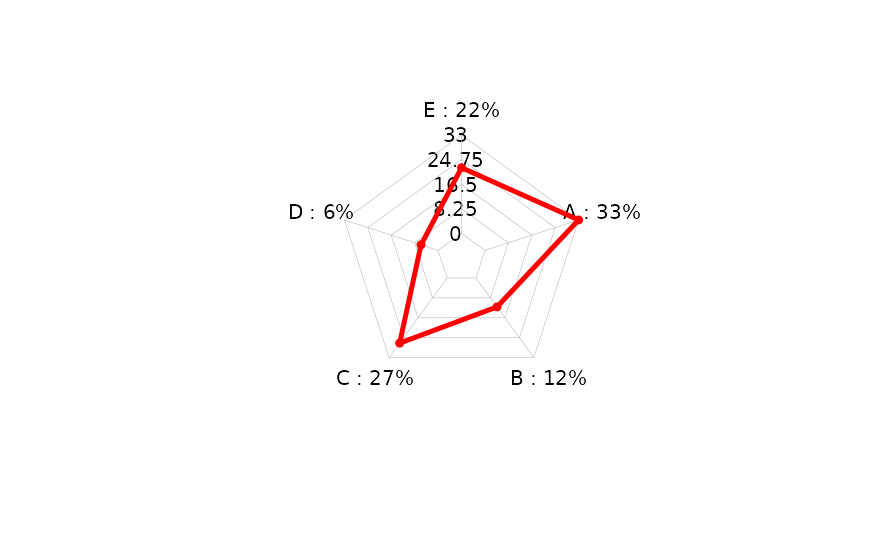
#> NULL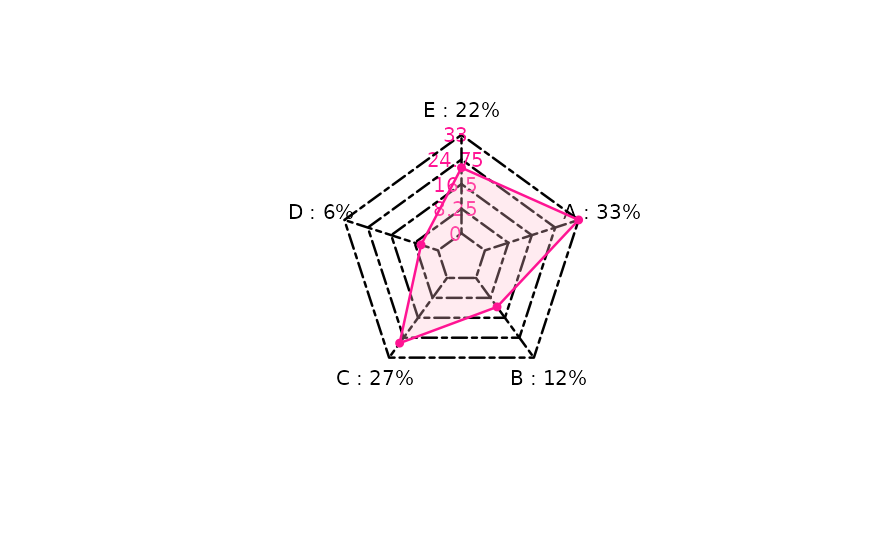
#> NULLAvailable templates for
bubble_blow()
Below you can see the different templates available for the function
bubble_blow() that allows the user to
easily create cool circular packing charts.
A fairly simple data frame with 10 groups will be considered.
Percentages will be displayed below the group labels (i.e. the argument
perc will be fixed to below), with the title
corresponding to the template name.
exblow <- data.frame(
  LETTERS[1:8],
  c(33, 24, 54, 12, 43, 88, 66, 78)
)

available_templates_bub <- c("bub1", "bub2", "bub3", "bub4", "bub5")

for(i in available_templates_bub){
  print(bubble_blow(exblow, template = i, perc = "below", title = i))
}


Example of usage of
pie_addimages()
At first, let’s create a list of jpeg images loaded using the
function readJPEG (for optimal and fast results, the use of
small files is recommended) :
img1 <- jpeg::readJPEG(system.file("img", "logo.jpeg", package="tastypie"))
img2 <- jpeg::readJPEG(system.file("img", "parents.jpeg", package="tastypie"))
img3 <- jpeg::readJPEG(system.file("img", "bob.jpeg", package="tastypie"))
img4 <- jpeg::readJPEG(system.file("img", "mark.jpeg", package="tastypie"))
imgs <- list(img1,img2,img3, img4)
Then, let’s create the ggplot object using pie_bake()
(without focusing on the template or other specifications, since only
labels and values will be used):
df <- data.frame(
  c("Mark fan", "My friend", "Tastypie logo", "My parents"),
  c(300, 250, 225, 325)
)
mypie <- pie_bake(df, template = "basic1")
Now it is possible to run
ppie_addimages() using the list of the
images and the created pie chart, selecting also the colours of the
graph’s borders and labels:
pie_addimages(
  mypie = mypie,
  imglist = imgs,
  perc = "below",
  lbl_col = "red",
  border_col = "grey"
) 