This function allows to user to display a pie chart by selecting the template,
the number of groups of interest and whether to display the proportions or not,
in order to make it easier to choose between the many templates available in the
package tastypie.
pie_templates(template, n_groups = 4, perc = FALSE)Arguments
- template
The chosen template.
- n_groups
A number from 2 to 9.
- perc
A logical value. Should the proportions be displayed?
Note that if the selected template is one of those to be used withpie_bake_pro(listed in thepie_template_list_provector), this argument is useless.
Value
A ggplot object. In particular, this function returns a pie (or similar) chart according to the choice of template and the other specifications provided.
See also
See all the available templates displayed here!
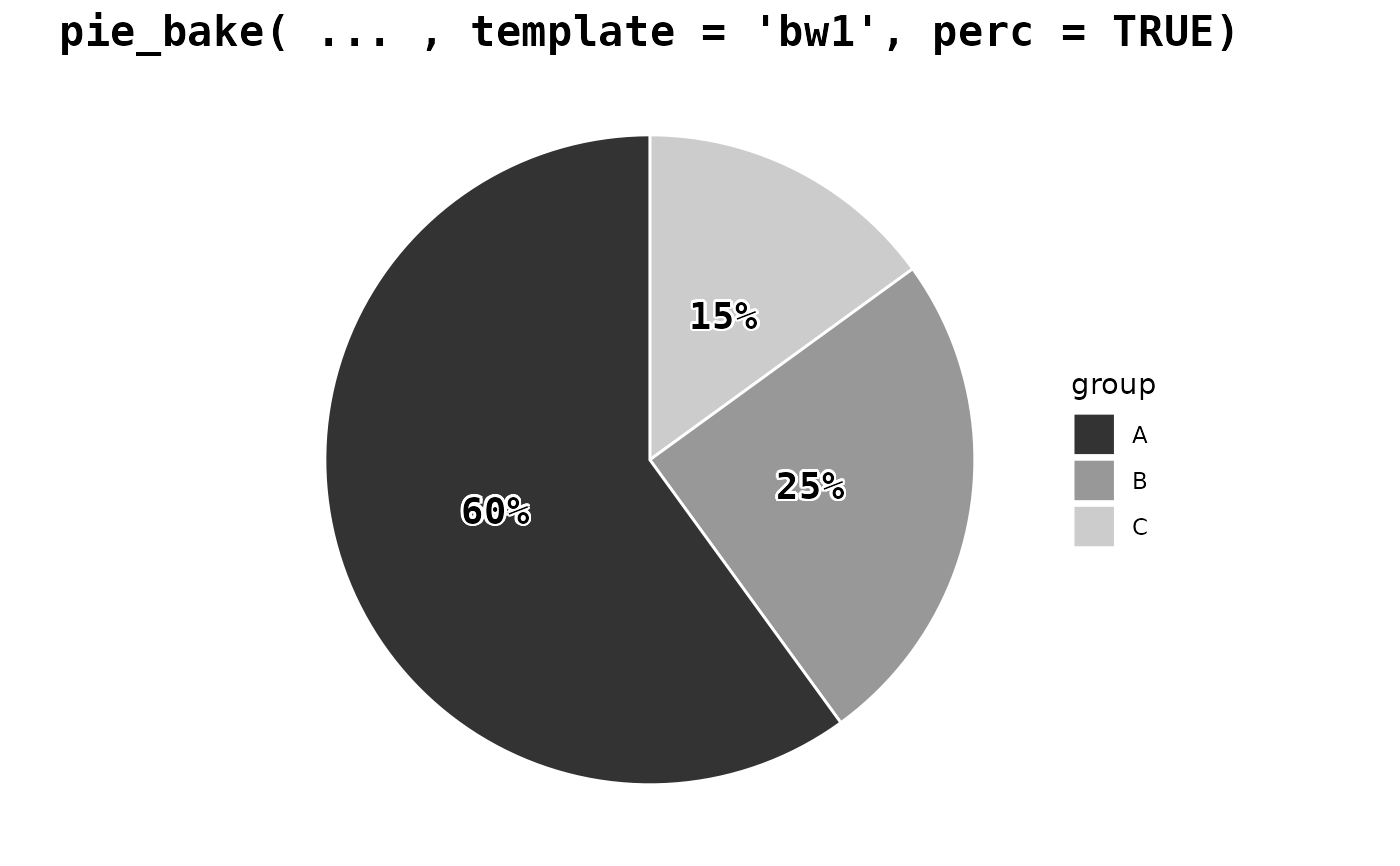
Examples
pie_templates(template = "bw1", n_groups = 3, perc = TRUE)

pie_templates(template = "watermelon2", n_groups = 8)